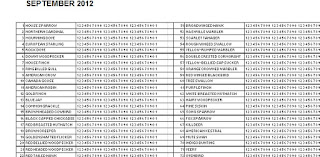
The first sheet of BIRDLIST is a general comment page that list the species, followed by a comment column that usually contains the first date I ever saw the bird in my yard and any other significant sightings. The last 12 columns represent the months of the year, with the months that the species has been seen in my yard highlighted in yellow.
Sheet two of BIRDLIST is a narrowed version of the first sheet minus the comment column. Its purpose is to allow me to fit 150 species on to one sheet printed in landscape format, that I can fold in thirds and leave in field guide that I use primarily in my yard. Here is a zoomed in view of sheet2.
The third sheet of BIRDLIST is the meat and potatoes, the dog that herds the sheep, the trashcan that catches the puke in the data gathering process. It lists the species, followed by the numbers 1 thru 0 three times followed by a fourth 1. Any guesses to what these numbers represent? Answer : the days of the month, the first 1-0 represent the days of the 1st-10th, the second group of numbers represent the days 11th-20th and so on. The dates were abbreviated due to space restrictions. I print one out each month and mark with a pen the days that I see each bird. At the end of the month I total all the days I saw each species.
Here are 3 photos of the sheet I used in September with explanations of the marks I made on it.
The data gathered monthly is totaled and entered into another Excel worksheet I call "BIRD SURVEY", that totals the number of days a species is seen for the year and compared to previous years.
| NAME | J | F | M | A | M | J | J | A | S | O | N | D | 2012 | 2011 | 2010 | 2009 | 2008 | |
| 1 | HOUSE SPARROW | 24 | 26 | 31 | 30 | 21 | 30 | 31 | 26 | 27 | 31 | 30 | 307 | 355 | 364 | 270 | 246 | |
| 2 | NORTHERN CARDINAL | 24 | 25 | 26 | 29 | 19 | 22 | 25 | 24 | 24 | 24 | 28 | 270 | 282 | 315 | 217 | 209 | |
| 3 | MOURNING DOVE | 14 | 23 | 29 | 30 | 19 | 22 | 15 | 20 | 26 | 20 | 19 | 237 | 252 | 247 | 196 | 205 | |
| 4 | EUROPEAN STARLING | 21 | 25 | 31 | 30 | 21 | 30 | 29 | 24 | 25 | 29 | 28 | 293 | 295 | 278 | 226 | 223 | |
| 5 | ROCK DOVE | 13 | 14 | 26 | 28 | 21 | 26 | 19 | 16 | 20 | 15 | 27 | 225 | 279 | 280 | 238 | 177 | |
| 6 | DOWNY WOODPECKER | 1 | 10 | 5 | 8 | 1 | 3 | 9 | 16 | 16 | 20 | 89 | 76 | 57 | 107 | 144 | ||
| 7 | HOUSE FINCH | 5 | 11 | 23 | 30 | 21 | 20 | 8 | 12 | 20 | 11 | 13 | 174 | 138 | 111 | 94 | 143 | |
| 8 | RING BILLED GULL | 20 | 14 | 29 | 30 | 21 | 28 | 21 | 18 | 22 | 16 | 24 | 243 | 203 | 179 | 164 | 139 | |
| 9 | AMERICAN CROW | 4 | 10 | 16 | 17 | 10 | 1 | 3 | 2 | 1 | 64 | 71 | 81 | 40 | 32 | |||
| 10 | CANADA GOOSE | 2 | 9 | 11 | 8 | 2 | 1 | 1 | 5 | 3 | 1 | 43 | 39 | 35 | 24 | 16 |


No comments:
Post a Comment